Historical Geography, GIS, and Civil War Washington
Geographic Information Systems (GIS) technology gives historical geographers the critical means with which to organize and synthesize implicitly spatial data from historical texts and explicitly spatial data of available maps. Even though new maps typically are the end result of GIS processing, it is perhaps better understood as a unique content management system that can store data by attaching layers of descriptive information to absolute location as well as to a database. Among its unique benefits is the ability to relate otherwise disparate data sources on the basis of common geography, revealing patterns that would otherwise have been invisible.1 The experience of developing Civil War Washington's geographic data demonstrates that making historical maps and historical data sources work for contemporary purposes is a process that is rife with challenges as well as rewards.
Though some cartographers ventured into basic thematic mapping as early as the seventeenth century, serious attempts to capture detailed information about society and store it in the form of a map did not come about until much later. Statistical cartography developed in the mid-nineteenth century in Austria, France, Prussia, and the United States, and it dealt with phenomena as diverse as agriculture, industry, diseases, and political outcomes.2 Because these early thematic maps were developed primarily as organizational devices or analytical tools for use within particular fields, historical spatial information is buried within the histories of fields that were often unrelated.3 Contemporary scholars may therefore need to synthesize disparate data sources in order to recognize and interpret basic patterns and relationships of the past that are not explicitly apparent from one map alone. There are, however, substantial limitations to the types of meaningful discoveries that might be made in this manner.
Most important, there are issues related to scale and projection of maps. Cartographers make careful decisions about what to map and where to map features, but also they have to decide how to transform three-dimensional features onto a two-dimensional plane, as well as how they will preserve spatial relationships amidst the transformation. Although historical maps might closely resemble one another in shape, size, or area, it is likely that few of them actually could be overlaid or compared directly to each other in a true geographic sense. Rather, some mathematical transformation is necessary to associate exact points with one another among two or more unlike maps. It is typically not possible to warp and manipulate the physical historical documents so that they align perfectly with one another, and visually approximating and subsequently replicating spatial relationships present on two or more different maps potentially introduces a significant amount of human subjectivity. Even when old maps do align well with each other, agglomerating only the existing information from historical cartography does not necessarily answer lingering questions about history: the exclusive use of map data as the primary source in historical arguments is limited to the original content included by cartographers.
Employing maps as a critical and organizing source among other primary sources yields potentially endless insights into the spatial realities of the past. Even though recorded human history spans thousands of years, thematic mapping did not exist widely until the late nineteenth century, and so scholars of earlier periods have only reference maps indicating places and relative locations. However, historical geographic information sources certainly are not limited only to what has been mapped. Rather, many spatial histories will be found in texts. Throughout history, people have left behind official government documents, preserved letters and journals, and many other descriptive records that include significant details about how space was used and how humans viewed themselves and their societies in relation to the world. These sources of information often include explicit mentions of addresses or places that can be translated into actual locations. Likewise, these records and details naturally become attributes and descriptions that can be associated or assigned to specific locations at specific periods in time. In particular, datasets such as the U.S. Census contain numerous records that include addresses, and they can be used to link a wealth of data to specific known spaces across time. It is also important to note that historical address information is not always useful for contemporary researchers: much of the built environment has changed over time, sometimes including complete rerouting, renumbering, and renaming of roads and places. The challenge of making the most of existing historical data, including the necessary combination of texts and old cartography, can be met in part by utilizing modern GIS.
Base Map Development
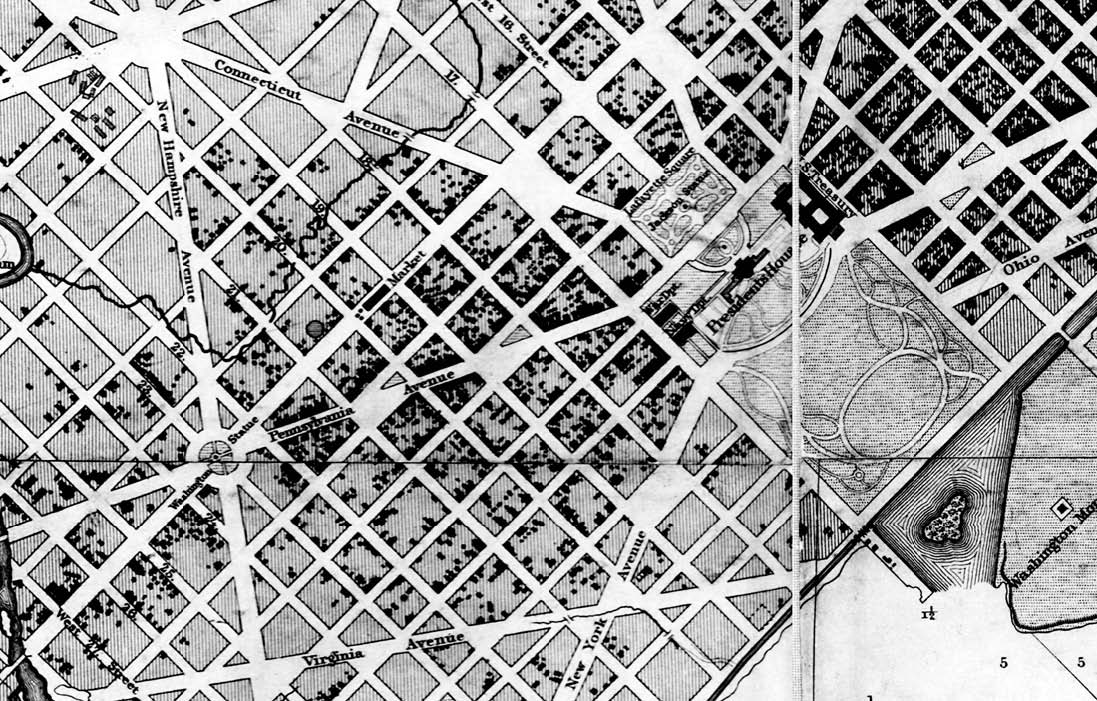
Unlike more recent geographic studies that can draw upon a multitude of satellite and aerial photographs or other widely available base map layers as a starting point or reference for plotting data, Civil War Washington is constrained to 1861–65, when traditional land surveys usually were the most accurate depictions of the ground and spatial relationships among features. Fortunately, Albert Boschke's highly detailed Topographical Map of the District of Columbia, produced from extensive surveys in the district, was completed on behalf of the federal government just prior to the American Civil War, and the Library of Congress maintains copies of the document. The Center for Digital Research in the Humanities requested and obtained a high-quality digital image scan of Boschke's map in TIFF format directly from the Library of Congress's Photoduplication Service for use in Civil War Washington.
Digital scans of quality historical cartography such as Albert Boschke's topographical map of Washington may represent space accurately in terms of the spatial relationships within the image file, but they do not tell GIS software the latitude and longitude of the points on the map, and so the software is unable to build accurate representations of space or make sense of the distances and areas of the image. While it is technically possible to generate data from a historical map that has not been georeferenced, any information extracted from that map or placed onto the map would not have any direct relationship to physical location, only a relative association to that map image, and therefore no information could be used with other maps or data. If geospatial data files are to be transferrable and accurate representations of the world, they need to be georeferenced prior to any analyses. Proper georeferencing defines for the GIS software the absolute location of a feature or image, using defined "ground control points" and mathematical transformations to adjust the object so that it fits a known and accurate projection of the real world.
Existing scholarship has acknowledged that natural deformations in the original document can introduce spatial error to the georeferencing process, which in turn influences both the quality of data that can be mined from the map as well as the feasibility of using it as an accurate reference map. A crease or fold that results in one millimeter of distortion in an original map drawn at 1:10,000 scale, for example, will result in ten meters of relative error in the real world.4 Such small spatial errors might be unnoticed or unimportant to casual viewers of the primary document, but they are very important sources of error affecting the georeferencing process in a GIS. Likewise, some literature on the subject has focused on minimizing these potential errors by quality controlling the image through basic techniques such as selecting the most appropriate scanner and image quality.5
The reality, however, is that some of the more coveted pieces of historical cartography may not be physically accessible in a way that gives a GIS specialist full control over the image creation. The Library of Congress alone retains the originals of many important documents of particular significance to historical geographers, such as Albert Boschke's maps of Washington DC. Although the image quality is excellent and the original document appears largely intact, any GIS user who wishes to georeference the file will encounter problems. Small gaps appear between some sections of the map, and streets are slightly misaligned in various places. Perhaps the technicians responsible for creating digital copies of the images attempted to piece together manually some of the disjointed sections of the original document before scanning it. While this gives the casual viewer the impression of completeness in the map when viewing the image as a whole, it may create more work for the GIS specialists who are subsequently tasked with georeferencing the images.
The base maps used by Civil War Washington all shared the human error associated with the scanning process of the original image. Each digital map was deconstructed into smaller components, usually divided where segments of the original image did not intersect properly due to gaps or misalignments. Map sections were carefully inspected and reduced to several individual pieces; the extent of each section depended on the contiguous parts of the raster image without a visible crease or fold or major misalignment at 1:1000 scale. Each piece of the image was then georeferenced individually and mosaicked back into a single raster dataset. Ultimately, the digital copy of Albert Boschke's 1861 Topographical Map of the District of Columbia was corrected and subsequently georeferenced in ESRI's ArcGIS Desktop 10.1, using a total of 491 ground control points and a spline transformation to ensure maximum spatial precision. Ian Gregory and Paul Ell note that it is typical for GIS projects to use four ground control points to align historical map images, although "rubber sheeting" methods are used at times to distort and align original layers when a high degree of accuracy is needed.6 Civil War Washington is intended to be an authoritative source of data, so all discernible mapped features that have not moved, such as physical corners of the U.S. Capitol Building, were matched to precise known coordinates of these same surface features in the contemporary world. The process created a reliable base layer upon which the feature layers could be identified and drawn, as can be seen at http://civilwardc.org/maps/flex/.
The Census Data Layer
Authors have noted previously the major challenges related to the study of household-level, historical urban demographic trends on a local scale: "Although we have no direct measure of income segregation before 1940, we know that ethnic segregation increased substantially during the late nineteenth and early twentieth centuries in response to the changed ecological structure of the city."7 Beginning with the 1850 census of population, however, United States Census records did include household-level social details about real estate value, occupation, and many other social statistics of interest to historians.8 The 1860 census and 1870 census also included information about values of personal estates, providing nineteenth-century historians with an opportunity to probe wealth distribution in a very direct way. Unfortunately, many technical barriers have prevented the deployment of these census records on a large scale to study issues such as the spatial distribution of wealth within a city.
Prior to the late 1960s, the U.S. government had no working geographic information system with which to store and maintain accurate spatial data.9 Likewise, very old census data are not easily assigned to specific coordinates. Individual population census records prior to 1880 actually do not list the addresses of those surveyed on the original schedules.10 Research may determine the historical addresses of those in the census records, but there is yet another obstacle. Some address numbering systems, such as the District of Columbia's, changed significantly before they became standardized. Modern address locator systems and automated geolocating are based on the logic and consistency in the numbering system of present-day cities, making it difficult for contemporary researchers to place these spatial data accurately.
Indeed, U.S. Census data available at the Civil War Washington GIS site is the product of a complex process. Original 1860 census records for the City of Washington were transcribed manually and tabulated in SPSS, and individuals' first and last names were matched exactly with the records listed in Boyd's Washington and Georgetown Directory (1860) to obtain address information. The SPSS data were then exported as a Microsoft Excel file for use with ArcGIS Desktop.
A street centerline shapefile was then digitized from the georeferenced Boschke base map image. Using the "Street Directory" section found in the 1865 edition of Boyd's Directory as a point of reference, individual line segments in the centerline shapefile were coded manually in ArcGIS with starting and ending address numbers for each side of the street, intended to correspond to the actual address numbering system used in 1860s Washington. After all address ranges were entered for each street segment, a customized address locator service was created in ArcGIS.
All records containing address information were geocoded using this customized address locator service, generating a point shapefile containing every applicable record. Some census records named only the nearest intersection, rather than a specific home address, and these points were simply left at the intersections but separated into a different layer. All other points were offset from the centerline file and placed at their most probable locations along the block. Where it was possible to match records precisely to an associated structure, the points were edited and relocated manually using Albert Boschke's 1857 Map of Washington City, District of Columbia, Seat of the Federal Government as a reference source for property lines and building locations. This earlier map delineates Washington's property lines and structures with a high level of detail, and it is drawn at a larger scale than his 1861 work, so there is less generalization. It is expected that most address "points" in the shapefile were geolocated very accurately to their historical positions using this combination of automated placement and manual readjustment.
Web GIS—Design
Civil War Washington shapefiles and base maps are saved as ESRI service definition files to a local server at the University of Nebraska. ArcGIS for Server 10.1 software is used for organizing and publishing these GIS data. The server software exposes the published data as Representational State Transfer (REST) services for web browsers, and the Civil War Washington Mapping Application "consumes" or uses these RESTful services by delivering to users a customized graphic interface.
The GIS site was customized using ESRI's ArcGIS Viewer for Flex, a web client mapping application designed to be used in tandem with ArcGIS for Server. Written in Flex 4, ArcGIS Viewer for Flex is a configurable web client application architecture built on the popular ArcGIS API for Flex that offers a range of analysis and mapping capabilities common to desktop ArcGIS functions.11 An application built from the ArcGIS Viewer for Flex can consume services distributed through a local ArcGIS server and ArcGIS Online, or it can be set to consume other published web data sources such as GEORSS feeds, KML files, or JSON/REST data. The design of the application container also simplifies the coding process by delegating mapping tasks and viewer design into a set of high cohesive and low coupling components that can be edited individually without causing friction with other elements of the application.12 The Civil War Washington mapping application architecture therefore is a solution intended to minimize project time investments with regard to development and site maintenance. However, the largest benefit of the design is how it serves the prospective audiences.
Civil War Washington GIS was built for full accessibility among all possible users, and it was intended that all site visitors would be presented with the same map features and application tools, regardless of their chosen internet browser. The ArcGIS Flex API chosen for Civil War Washington is a plug-in based type of rich internet application (RIA) framework with compact architecture and extensive built-in features in its controls.13 Because a plug-in is used to deliver the rich application content, quality can be ensured across all major supported browsers.14 Although a browser plug-in is required in order for prospective users to access the content, Flex operates within Adobe Flash, which is already installed and supported on 99 percent of Internet connected computers.15 Consequently, the GIS site maximizes the potential audience while providing a robust mapping application that allows users to query map data, customize views, and perform limited geoprocessing tasks.
In addition to technical considerations that promote full accessibility, the Civil War Washington mapping application also aims for simplicity in design to accommodate a range of potential visitors. At present, almost every casual internet user is likely to use web GIS at some point, and interactive map applications are now expected services in many fields.16 However, despite the widespread use of internet mapping, very few individuals possess the necessary training or education to allow them to process and use spatial information in the same way as a GIS expert would. One study involving volunteer users of a citizen science web site found that those volunteers without a background in GIS experienced difficulty understanding concepts such as map "layers" in the legend, and they had general problems interpreting map icons and tooltip content in an initial design of a web GIS application.17 The intent of Civil War Washington, then, was to develop a site that offered a rich environment for experts familiar with the data but not to design it so that it would become overly complicated for general public visitors who simply might want to explore the map's features. Consequently, most of the core data layers, such as those for hospitals and churches, have been set to be activated and drawn onto the map by default when the application loads. The window loads with intuitive in-browser controls over the map views, and the map includes features that expose their attributes in a pop-up box when clicked, much like popular general mapping applications such as Google Maps. Meanwhile, the actual feature layers drawn on the map remain searchable and downloadable for expert users who want to acquire data and run analyses of their own.
GIS in Practice: What GIS Reveals about Civil War Washington
The two examples discussed in this section primarily use the census data layer of Civil War Washington GIS to investigate some basic socioeconomic and race issues in the First Ward and to offer some preliminary findings about life in the American capital city at the beginning of the war. In the first example, data presented by the Civil War Washington web mapping application alone are used to draw basic inferences about the city. In the series of examples that follow, the publicly available GIS data have been downloaded from the site and imported into ArcGIS for standard desktop analysis and more elaborate examination. These examples illustrate how either approach can yield meaningful information, but the second example in particular demonstrates the extent of information that has been made available through the application.
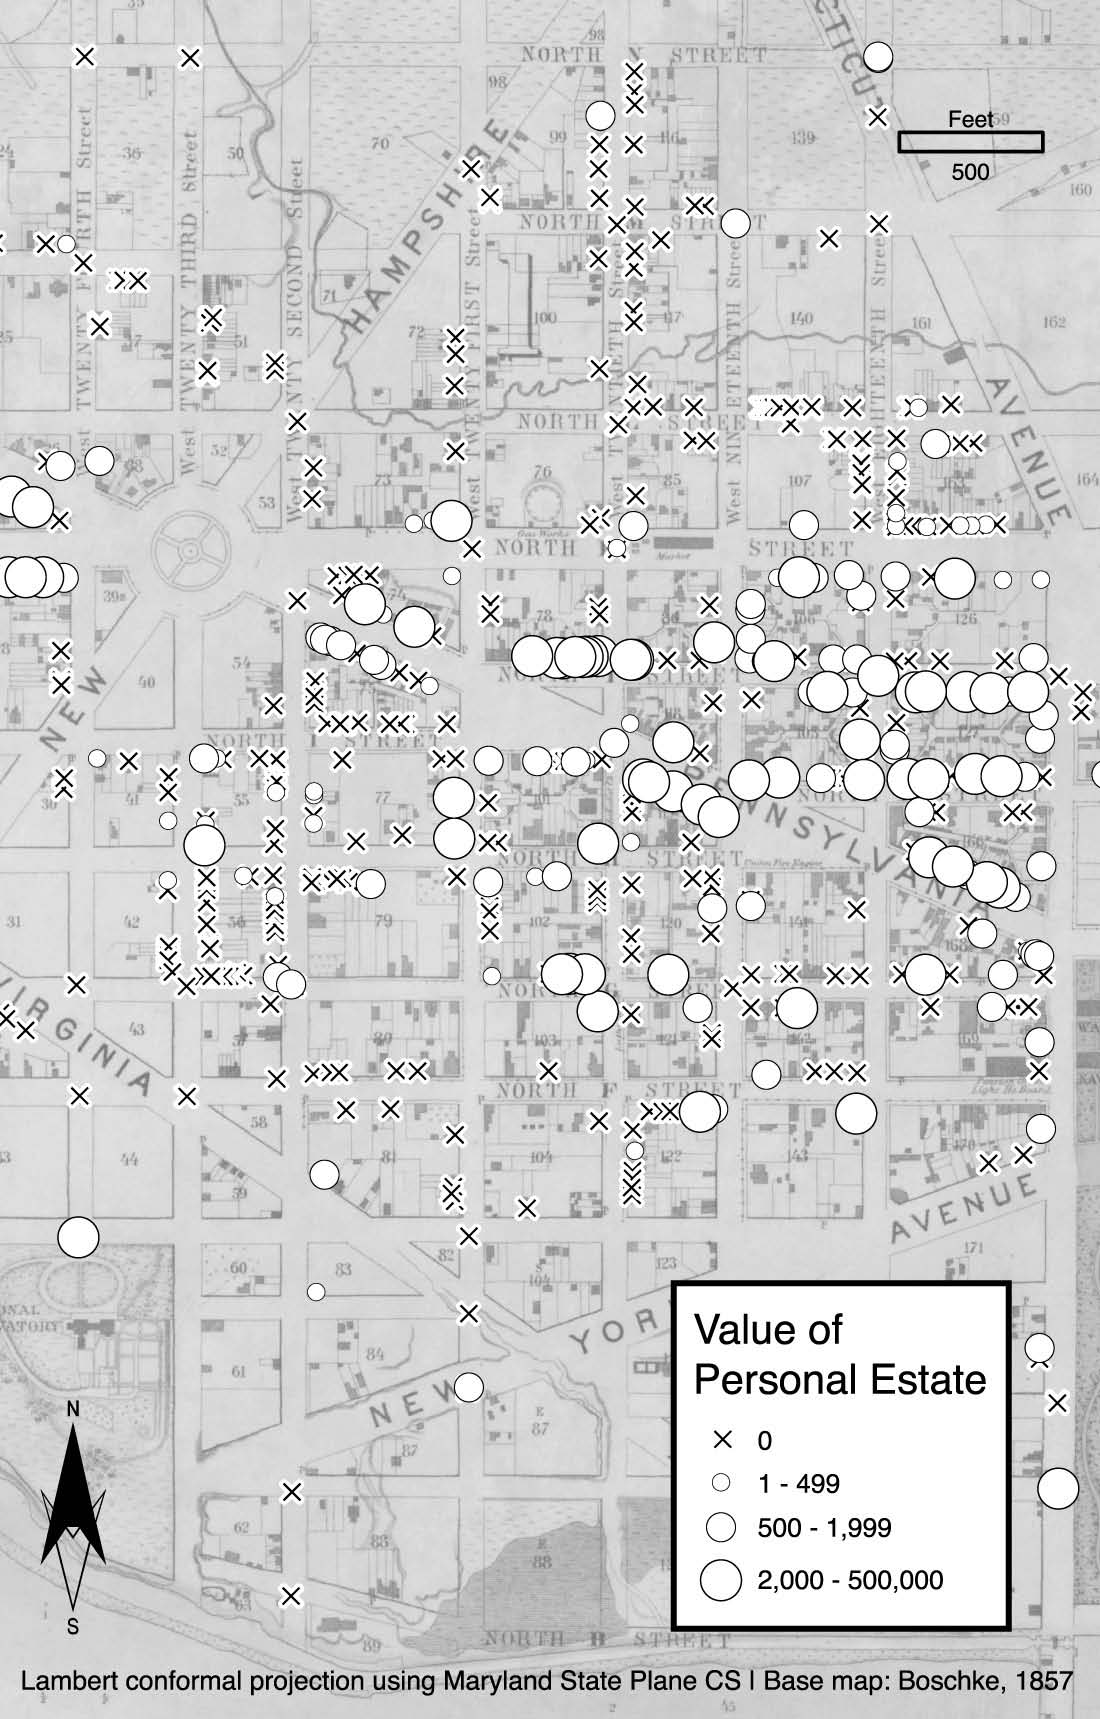
We were interested in studying the social conditions within Washington near the start of the war. In addition to reading firsthand anecdotes and looking at images of the city to begin to develop an understanding, the Civil War Washington GIS application provides an important tool for studying how conditions varied across space and shaped neighborhoods or even specific streets. As previously mentioned, the 1860 census records contain answers to questions about the net worth of each head of household's personal estate, as well as the total value of real estate. When mapped, these features immediately provide a very strong visual representation of the distribution of wealth within Washington's First Ward. Most important, each of these points contains more detailed data that can be used in further quantitative analyses. In the web application view, each point also can be clicked to check on specifics of that record.
On a very basic level, the available census records show that the average net worth of personal estates was astronomically higher in the city blocks north of Lafayette Square, located just north of the President's House. Likewise, personal estates were higher in city blocks located closer to Pennsylvania Avenue, whereas outlying areas tended to have very low personal estate values. Indeed, a number of city blocks that were relatively more distant from both Pennsylvania Avenue and the area about Lafayette Square reveal an average personal estate value of $0 in those places, indicating that none of the residents there claimed any significant financial assets.
Mapping select occupations provides further insight into the socioeconomic segregation of Washington's First Ward in 1860. Occupation data are available in pop-up information boxes when features are clicked, but there is too much variance in titles to symbolize this data automatically in the online GIS system. The census data were downloaded as individual GIS layers and processed using ArcMap 10.1. A simple SQL query was used to select laborers, plasterers, and wagoners and group them into a new layer, to represent some of the expected lower-income, working-class occupations not associated with indentured servitude or domestic labor. Clerks, grocers, and merchants were selected to represent the business class of citizens who likely had a little more income and economic security. Finally, bankers, gentlemen, and lawyers were selected to represent the obvious socioeconomic elite of the period. These samples of occupations were grouped into three distinct symbol classes and mapped according to their home addresses on the census form. Selected occupations and average personal estate values for each city block, including the estate values of all other occupations, were mapped together.
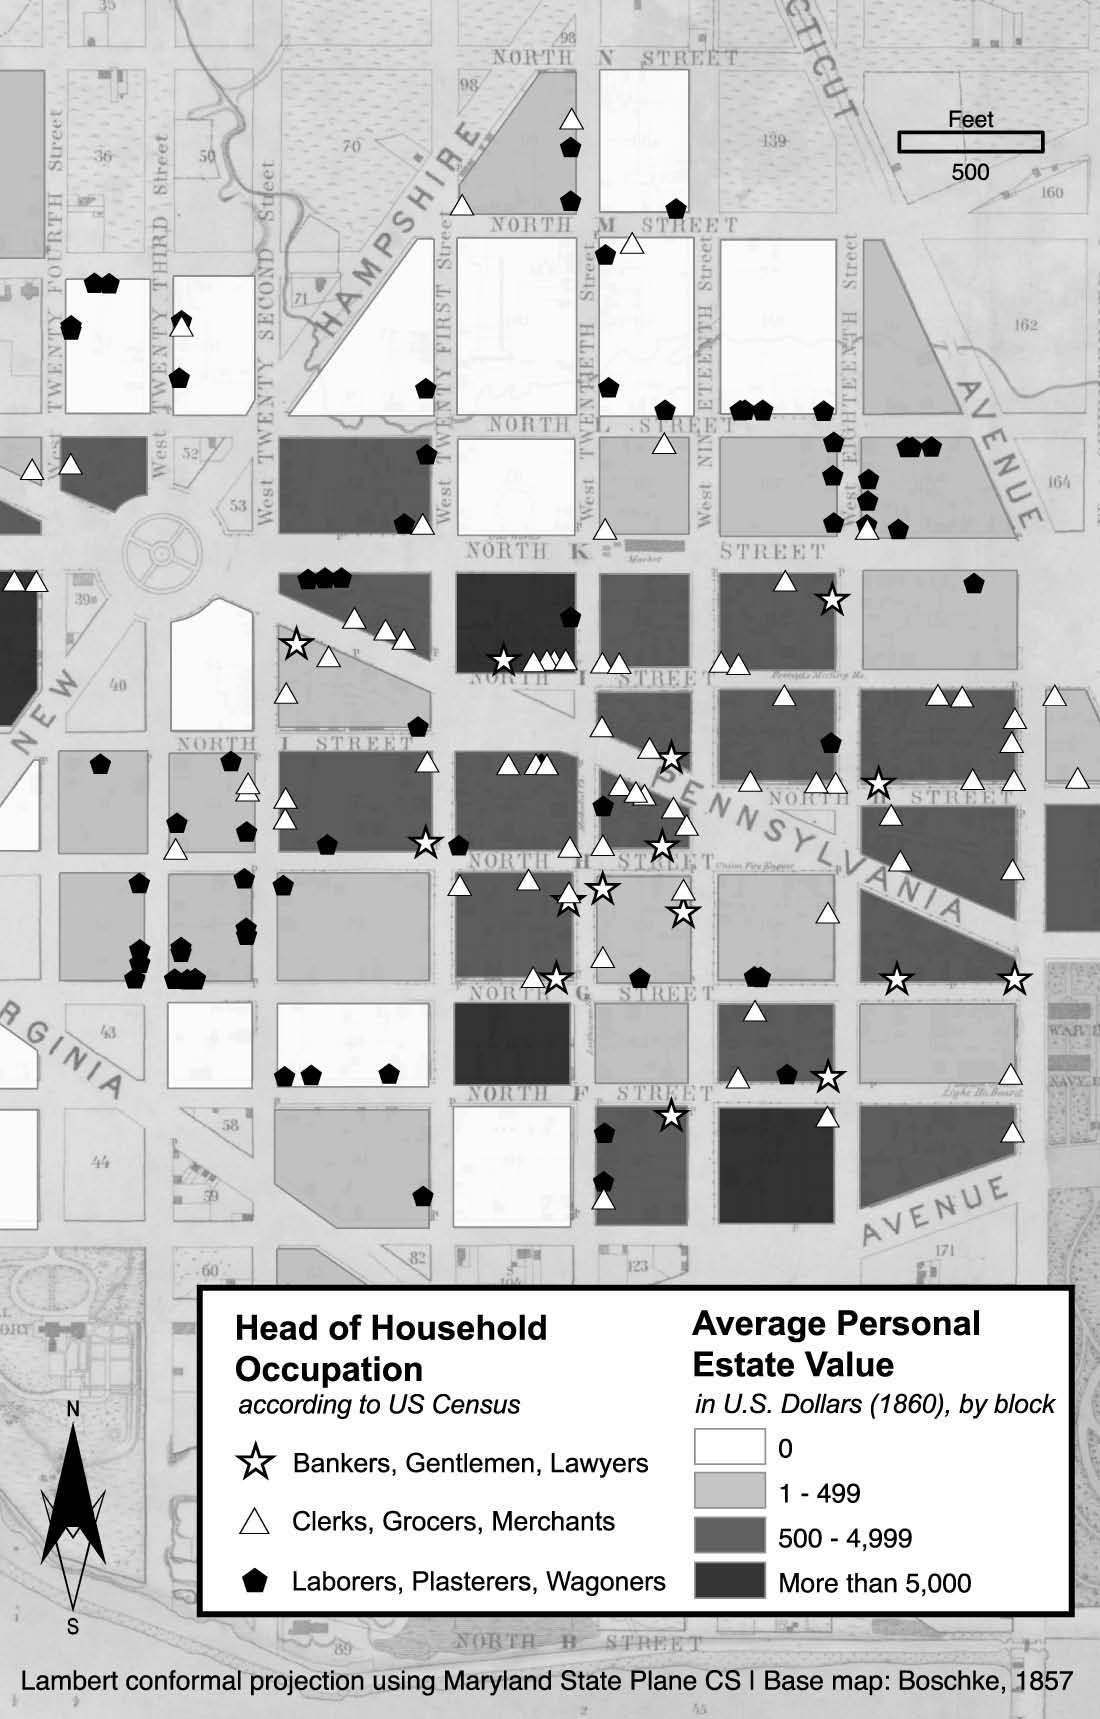
Once again, the mapped data illustrate a general spatial trend: those who were laborers, plasterers, and wagoners tended to live on the relative "outskirts" of the developed part of town in 1860. Very few of these people lived alongside the merchant class, and almost none of them lived near economic elites. More than a dozen city blocks were inhabited entirely by working-class folks, and these tended to be the city blocks reporting a mean personal estate value of $0, closer to the margins of the city. Although there are several exceptions to the rule, the overall reality of life in Washington just prior to the Civil War appears to be one of fairly prevalent socioeconomic segregation in residences, based upon data from the First Ward. Workers lived away from the main thoroughfares, and the more economically secure people generally built their homes along Lafayette Square or the iconic Pennsylvania Avenue.
A third and final example explores spatial dimensions of race in the district. Data were imported into ArcMap for analysis as in the previous exercise, but actually it is one phenomenon that could have been studied simply by using the site's GIS application because race is a standard selectable layer. When examining issues of race using Civil War Washington's datasets, however, it is important to note that mapped census records show information about heads of household rather than all people. The most notable omission, then, is that of Washington's enslaved population. Still, when these data are mapped, the resulting pattern appears to add a dimension of segregation seen in Civil War Washington.
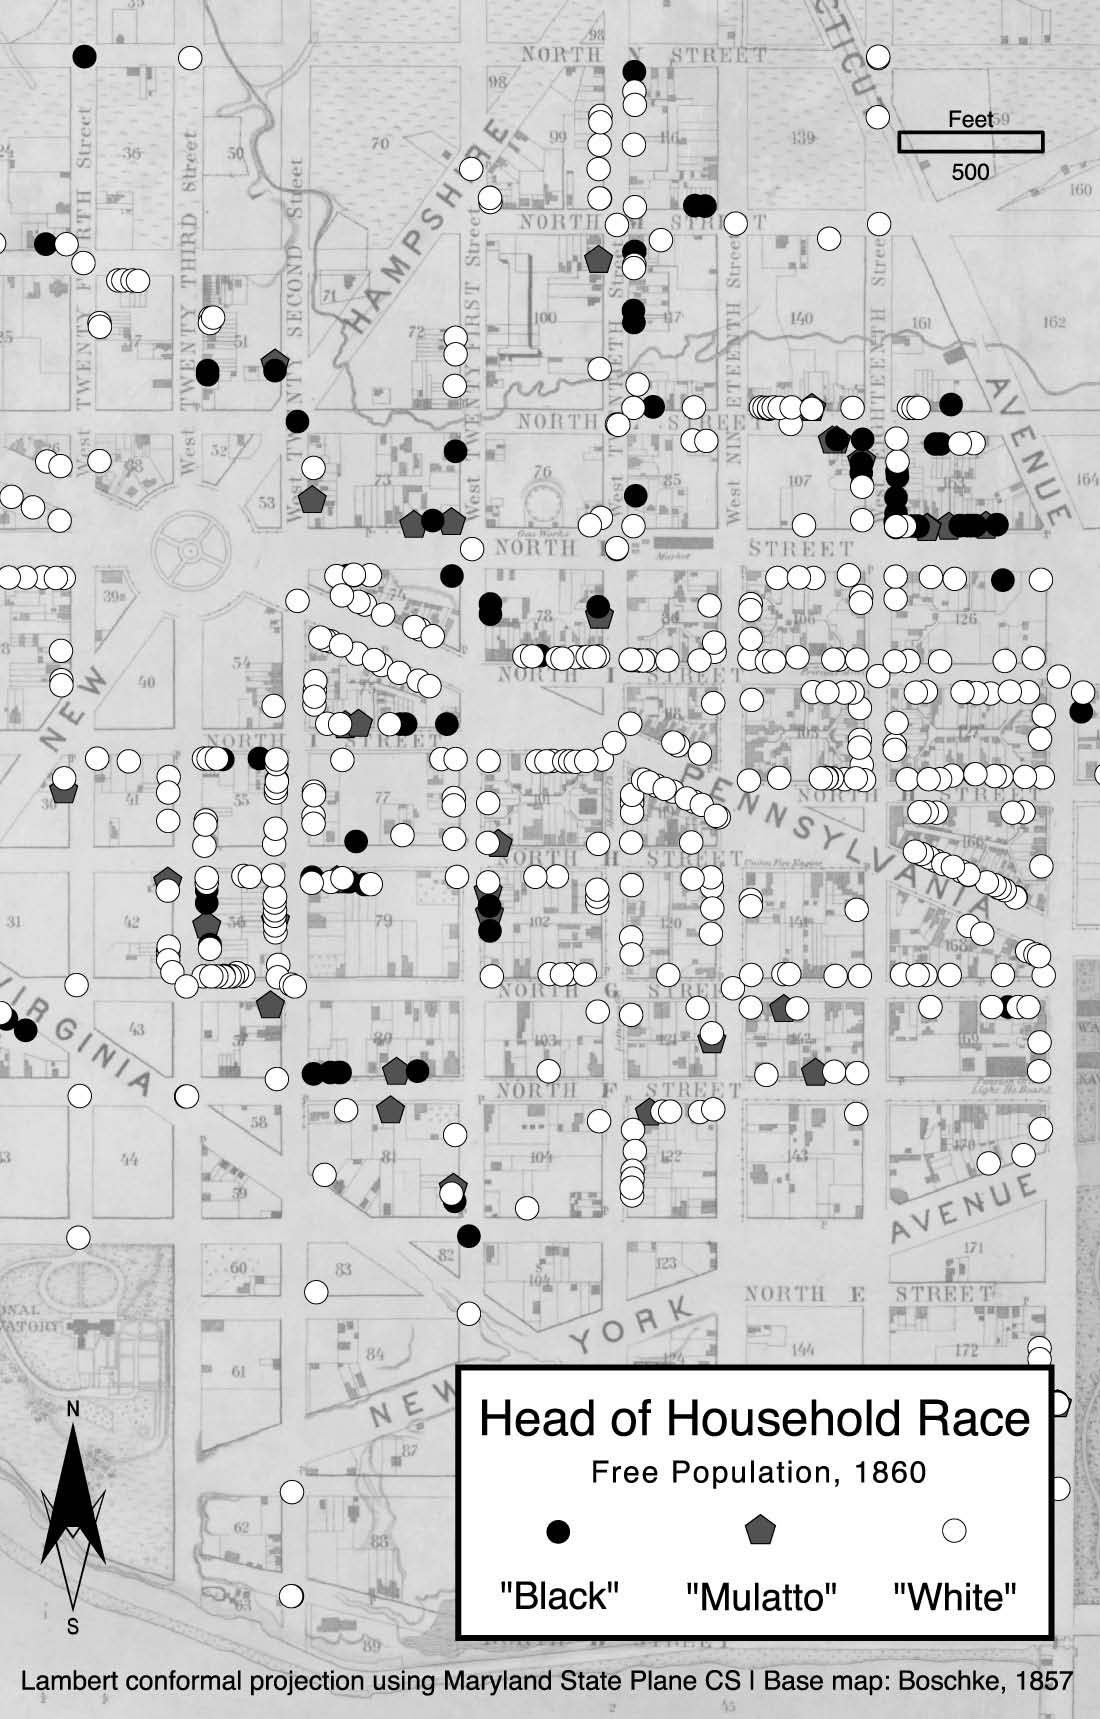
Some white residents certainly lived near free black residents in Washington, but there appears to have been some degree of discernible racial separation in the First Ward. Specifically, free people of color were almost completely absent from the dwellings along Lafayette Square and the blocks adjacent to Pennsylvania Avenue, while other, more distant blocks were majority African American.18 Obviously, a more thorough analysis would engage a wider study area to confirm whether or not the First Ward is merely anomalous, but from the map alone, it appears that some sections closer to the core of the city were controlled entirely by white people. This is not nearly as extreme as the rampant racial segregation of some twentieth- and twenty-firstcentury American cities, but it is still noteworthy.
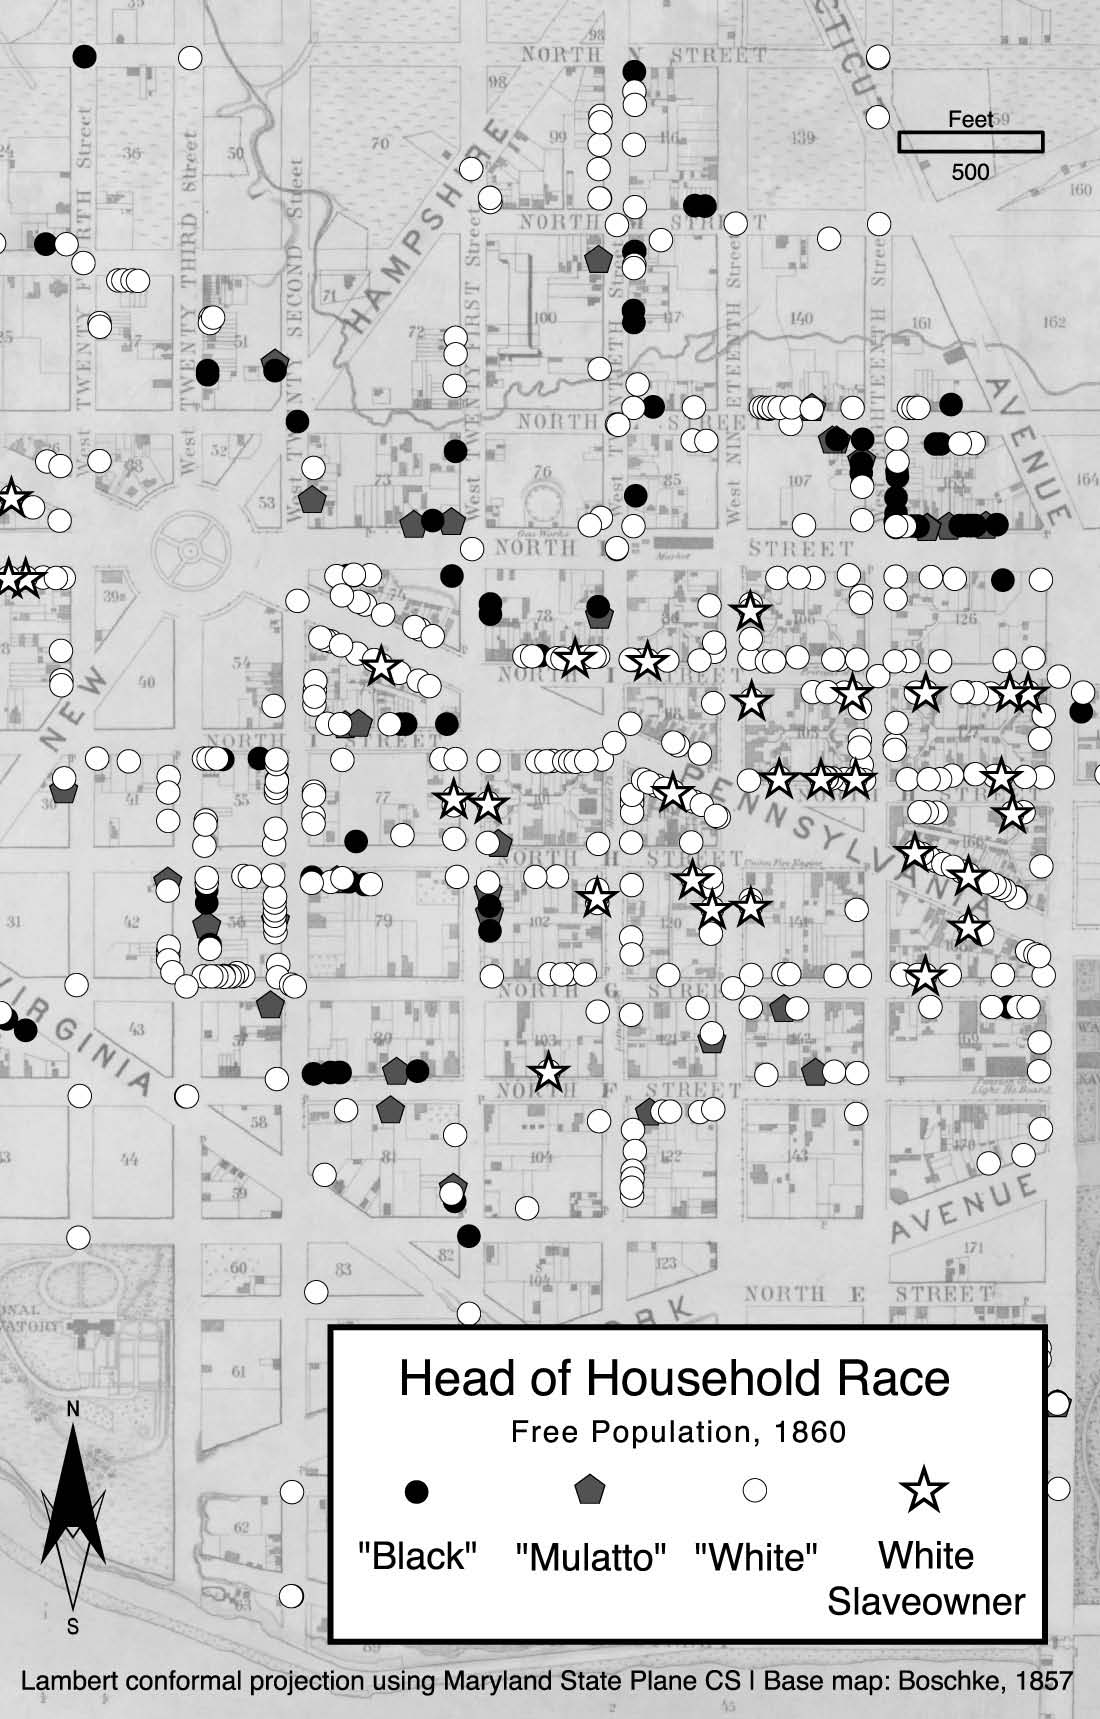
Again, it would be inaccurate to claim that all black residents were absent entirely from the wealthy areas controlled by Washington's privileged class. It is notable that those blocks that were exclusively white based on head of household census records also contained a number of slave owners, many of whom presumably kept living quarters for their slaves in accordance with the city's Black Code, which required them to do so. When a GIS layer of slave owners is overlaid on top of the head of household race data, it is clear that slave owners also were concentrated in those wealthy areas that had appeared to be exclusively white based upon the race data layer alone.
Residential segregation in 1860 Washington therefore appears to be a complex phenomenon, based not exclusively on race but on a combination of race and status. Free residents of color do not appear to have lived among the white upper classes at all in 1860. Meanwhile, enslaved people of color certainly inhabited these prominent areas alongside those who claimed to own them. Thus, on the eve of the Civil War, America's capital city may not have been a segregated place, but it was not exactly an integrated place, either.
Conclusion
Donald DeBats and Ian Gregory have noted that awareness of segregation and spatial concentrations of social groups can only really be understood when working with data at an individual level, and they find that more recent work in the field of historical GIS is using large databases constructed from individual-level information.19 Between head of household-level census records, point data for every known church, hospital, and theater in the city, and the dozen other individual feature layers on the site, Civil War Washington provides an elaborate source of information spanning a variety of topics. The previous examples reveal that GIS adds an important component to the historical scholarship of the project as a whole, and it should provide useful functionality whether or not a user has familiarity with geospatial processing software.
Mapping historical data in dynamic ways actually may provide researchers with information that exceeds the assumed limits of potential scholarship, opening entirely new routes of study for those historians who are willing to ask questions of the spatial distribution of data. The data views and tools of Civil War Washington's online GIS application are not intended to replace all desktop GIS functions but rather to establish a simple GIS environment that can be accessed and explored by a range of users. Similarly, the examples from the previous sections are not intended to answer definitively any historical questions about the social situation of prewar Washington. Rather, it is expected that these tools and data will be used together by the audience to generate many additional insights into the history of Washington during the Civil War.
Notes
This essay was first published in Civil War Washington: History, Place, and Digital Scholarship, ed. Susan C. Lawrence (Lincoln: University of Nebraska Press, 2015). It is reproduced with permission and has been revised and updated for publication here, as described in "Civil War Washington: The City and the Site." The copyright to this essay is held by the Board of Regents of the University of Nebraska, and Civil War Washington's Creative Commons license does not apply to it.
- P. Fu and J. Sun, Web GIS: Principles and Applications (Redlands CA: ESRI Press, 2010). [back]
- J. Clark, Steve Lavin, K. C. Martis, and Fred Shelly, Historical Atlas of U.S. Presidential Elections, 1788–2004 (Washington DC: Congressional Quarterly Press, 2006). [back]
- Susan Schulten, Mapping the Nation: History and Cartography in Nineteenth-Century America (Chicago: University of Chicago Press, 2012). [back]
- Ian Gregory and Paul S. Ell, Historical GIS: Technologies, Methodologies, and Scholarship (New York: Cambridge University Press, 2007). [back]
- Gregory and Ell, Historical GIS. [back]
- Gregory and Ell, Historical GIS. [back]
- Douglas S. Massey, "The Age of Extremes: Concentrated Affluence and Poverty in the Twenty-First Century," Demography 33 (1996): 395–412 (emphasis mine). [back]
- U.S. Bureau of the Census, 200 Years of Census Taking: Population and Housing Questions, 1790–1990 (Washington DC: Bureau of the Census, 1989). [back]
- Roger Tomlinson, "Geographic Information Systems—a New Frontier," in Introductory Readings in Geographic Information Systems, ed. Donna J. Peuquet and Duane F. Marble (New York: Taylor & Francis, 1991). [back]
- U.S. Bureau of the Census, "Availability of Census Records about Individuals," Factfinder for the Nation, cff no. 2 (Rev.), U.S. Government, 1997. Available at http://www.census.gov/prod/2/gen/cff/cff-9702.pdf. [back]
- ESRI, "Welcome to ArcGIS Viewer for Flex," ArcGIS Resource Center (2012), at http://help.arcgis.com/en/webapps/flexviewer/help/index.html#/Welcome_to_ArcGIS_Viewer_for_Flex/01m300000015000000/ Access date 10/29/12; Derek Law, "5ive Reasons to Use the ArcGIS Viewer for Flex" ArcUser Online (Spring 2011) at http://www.esri.com/news/arcuser/0311/files/5forflex.pdf. [back]
- Moxie Zhang, Developer's Guide: Create Geo Web Applications with the Sample Flex Viewer (Redlands CA: Esri Press, 2008). [back]
- Songnian Li, Chenfeng Xiong, and Ziqiang Ou, "A Web GIS for Sea Ice Information and an Ice Service Archive," Transactions in GIS 15 (2011): 189–211. [back]
- ESRI, "Which API Should I Use: JavaScript, Flex, or Silverlight?" Questions and Answers, 2010 ESRI International User Conference, San Diego CA, July 12–16, 2010. [back]
- Eric Tate, Christopher G. Burton, Melissa Berry, Christopher T. Emrich, and Susan L. Cutter, "Integrated Hazards Mapping Tool," Transactions in GIS 15 (2011): 689–706. [back]
- Fu and Sun, Web GIS. [back]
- Greg Newman, Don Zimmerman, Alycia Crall, Melinda Laituri, Jim Graham, and Linda Stapel, "User-Friendly Web Mapping: Lessons from a Citizen Science Website," International Journal of Geographical Information Science 24 (2010): 1851–69. [back]
- A more comprehensive explanation of residential segregation relating to rent costs is detailed in Kenneth Winkle's essay, "Emancipation in the District of Columbia." [back]
- Donald DeBats and Ian Gregory, "Introduction to Historical GIS and the Study of Urban History," Social Science History 35 (2011): 455–63. [back]